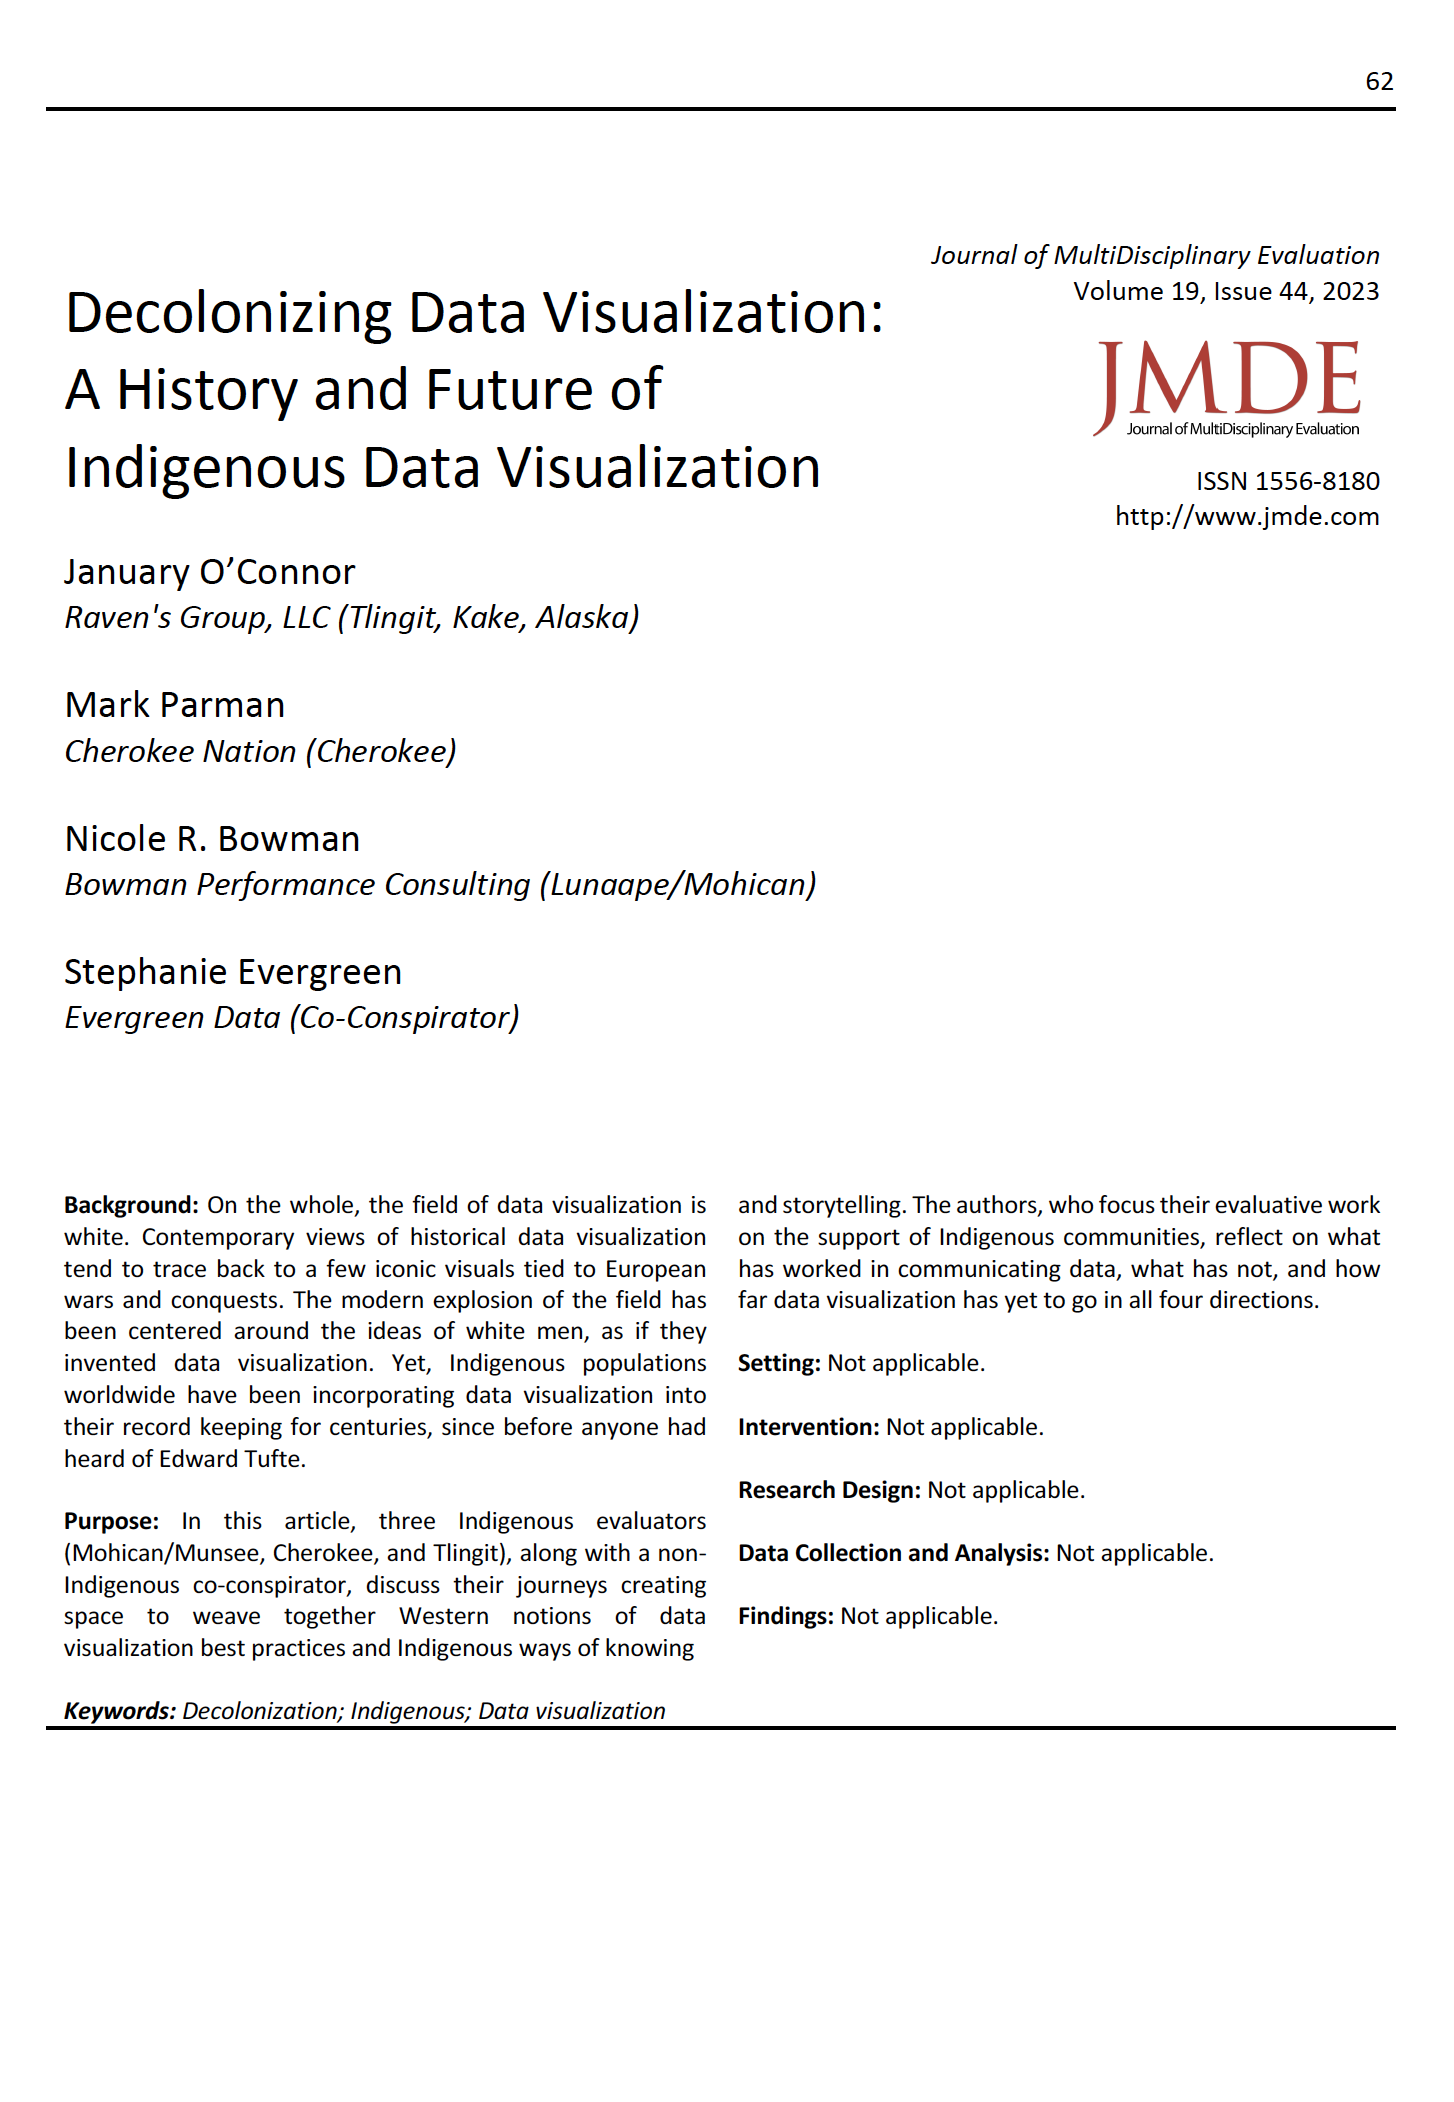
Decolonizing Data Visualization: A History and Future of Indigenous Data Visualization
Main Article Content
Abstract
On the whole, the field of data visualization is white. Contemporary views of historical data visualization tend to trace back to a few iconic visuals tied to European wars and conquests. The modern explosion of the field has been centered around the ideas of white men, as if they invented data visualization. Yet, Indigenous populations world-wide have been incorporating data visualization into their record keeping for centuries before anyone had heard of Edward Tufte. In this article, three Indigenous evaluators (Mohican/Munsee, Cherokee, and Tlingit) along with a non-Indigenous co-conspirator, will discuss their journeys creating space to weave together Western notions of data visualization best practices and Indigenous ways of knowing and storytelling. The authors focus their evaluative work on the support of Indigenous communities and will reflect on what has worked in communicating data, what hasn't, and how far data visualization has to go in all four directions.
Downloads
Article Details

This work is licensed under a Creative Commons Attribution-NonCommercial 4.0 International License.
Copyright and Permissions
Authors retain full copyright for articles published in JMDE. JMDE publishes under a Creative Commons Attribution-NonCommercial 4.0 International License (CC BY - NC 4.0). Users are allowed to copy, distribute, and transmit the work in any medium or format for noncommercial purposes, provided that the original authors and source are credited accurately and appropriately. Only the original authors may distribute the article for commercial or compensatory purposes. To view a copy of this license, visit creativecommons.org
References
Andrews, R. J. (2020. Data visualization and the modern imagination. David Rumsey Map Center, Stanford University. https://exhibits.stanford.edu/dataviz
Atlantic Council for International Cooperation. (2017). Medicine wheel evaluation framework [White paper]. https://static1.squarespace.com/static/58eb972e414fb5fae517f552/t/59cd121af9a61e43a95191c6/1506611739652/Medicine_Wheel_Evaluation_Framework.pdf
Azzam, T., Evergreen, S., Germuth, A. A., & Kistler, S. J. (2013). Data visualization and evaluation. New Directions for Evaluation, 139, 7-32. https://doi.org/10.1002/ev.20065 DOI: https://doi.org/10.1002/ev.20065
Borkin, M. A., Bylinskii, Z., Kim, N. W., Bainbridge, C. M., Yeh, C. S., Borkin, D., Pfister, H., & Oliva, A. (2016). Beyond memorability: Visualization recognition and recall. IEEE Transactions on Visualization and Computer Graphics, 22(1), 519-528. https://doi.org/10.1109/TVCG.2015.2467732 DOI: https://doi.org/10.1109/TVCG.2015.2467732
Bowman-Farrell, N. R. (2019). Nation-to-nation evaluation: Governance, tribal sovereignty, and systems thinking through culturally responsive Indigenous evaluations. Canadian Journal of Program Evaluation, 34(2). https://doi.org/10.3138/cjpe.67977 DOI: https://doi.org/10.3138/cjpe.67977
Bremner, L., & Bowman, N. (2021). Roots and relations: Celebrating good medicine in Indigenous evaluation / Nos racines et nos liens: Célébrons l'évaluation autochtone. Canadian Journal of Program Evaluation, 36(2). https://doi.org/10.3138/cjpe.72865.en DOI: https://doi.org/10.3138/cjpe.72865.fr
Chilisa, B. (2019). Indigenous research methodologies. Sage.
Foote, M. Q., & Bartell, T. G. (2011). Pathways to equity in mathematics education: How life experiences impact researcher positionality. Educational Studies in Mathematics, 78(1), 45-68. http://www.jstor.org/stable/41485940 https://doi.org/10.1007/s10649-011-9309-2 DOI: https://doi.org/10.1007/s10649-011-9309-2
Friendly, M. & Wainer, H. (2021). A history of data visualization and graphic communication. Harvard University Press. https://doi.org/10.4159/9780674259034 DOI: https://doi.org/10.4159/9780674259034
Holmes, A. G. D. (2020). Researcher positionality - A consideration of its influence and place in qualitative research - A new researcher guide. Shanlax International Journal of Education, 8(4), 1-10. https://doi.org/10.34293/education.v8i4.3232 DOI: https://doi.org/10.34293/education.v8i4.3232
Jenkins, S., Robinson, K., & Davis, R. (2015, December 1-3. Adapting the medicine wheel model to extend the applicability of the traditional logic model in evaluation research. [Paper presentation]. 2015 Federal Committee on Statistical Methodology Research Conference, Washington, DC, United States.
Keefer, T. (2014, March/April). A short introduction to the two row wampum. Briarpatch Magazine. https://briarpatchmagazine.com/articles/view/a-short-introduction-to-the-two-row-wampum
Kovach, M. (2010). Indigenous methodologies: Characteristics, conversations, and contexts. University of Toronto Press.
Lucchesi, A. & Echo-Hawk, A. (2018). Missing and murdered indigenous women & girls: A snapshot of data from 71 urban cities in the United States. [White paper]. Urban Indian Health Institute. https://www.uihi.org/wp-content/uploads/2018/11/Missing-and-Murdered-Indigenous-Women-and-Girls-Report.pdf
Marsh, T. N., Cote-Meek, S., Toulouse, P. R., Najavits, L. M., & Young, N. L. (2015). The application of two-eyed seeing decolonizing methodology in qualitative and quantitative research for the treatment of intergenerational trauma and substance use disorders. International Journal of Qualitative Methods, 14(5). https://doi.org/10.1177/1609406919869695 DOI: https://doi.org/10.1177/1609406915618046
Medrano, M., & Urton, G. (2018). Toward the decipherment of a set of mid-colonial khipus from the Santa Valley, coastal Peru. Ethnohistory, 65(1), 1-23. https://doi.org/10.1215/00141801-4260638 DOI: https://doi.org/10.1215/00141801-4260638
Minard, C. J. (1869). Data visualization of Napoleon's 1812 march on Moscow [Figurative map], Evergreen Data, stephanieevergreen.com/decolonizing-data-viz/
Nightingale, F. (1859). Diagram of the causes of mortality in the army in the east [Figurative map]. Data visualization and the modern imagination, David Rumsey Map Center, Stanford, CA, United States.
Priestley, J. (1769). A new chart of history [Figurative map]. Data visualization and the modern imagination, David Rumsey Map Center, Stanford, CA, United States.
Savin-Baden, M., & Major, C. H. (2013). Qualitative research: The essential guide to theory and practice. Routledge.
Scaife, A. H. (1897). History of the Civil War in the United States [Figurative map]. Data visualization and the modern imagination, David Rumsey Map Center, Stanford, CA, United States.
Smith, L. T. (2021). Decolonizing methodologies: Research and Indigenous peoples. Bloomsbury Publishing.
Sul, D. A. (2021). Indigenous assessment developers on elements of the disjuncture-response dialectic: A critical comparative case study (Publication No. 571) [Doctoral dissertation, University of San Francisco]. University of San Francisco Scholarship Repository.
Waapalaneexkweew (Bowman-Farrell, N. R.). (2018). Looking backward but moving forward: Honoring the sacred and asserting the sovereign in Indigenous evaluation. American Journal of Evaluation, 39(4), 543-568. https://doi.org/10.1177/1098214018790412 DOI: https://doi.org/10.1177/1098214018790412
Wilder, S. A. (2022, March 29). Handmade in Punjab: Embroidered data in phulkaris. Data Literacy. https://dataliteracy.com/handmade-in-punjab/

